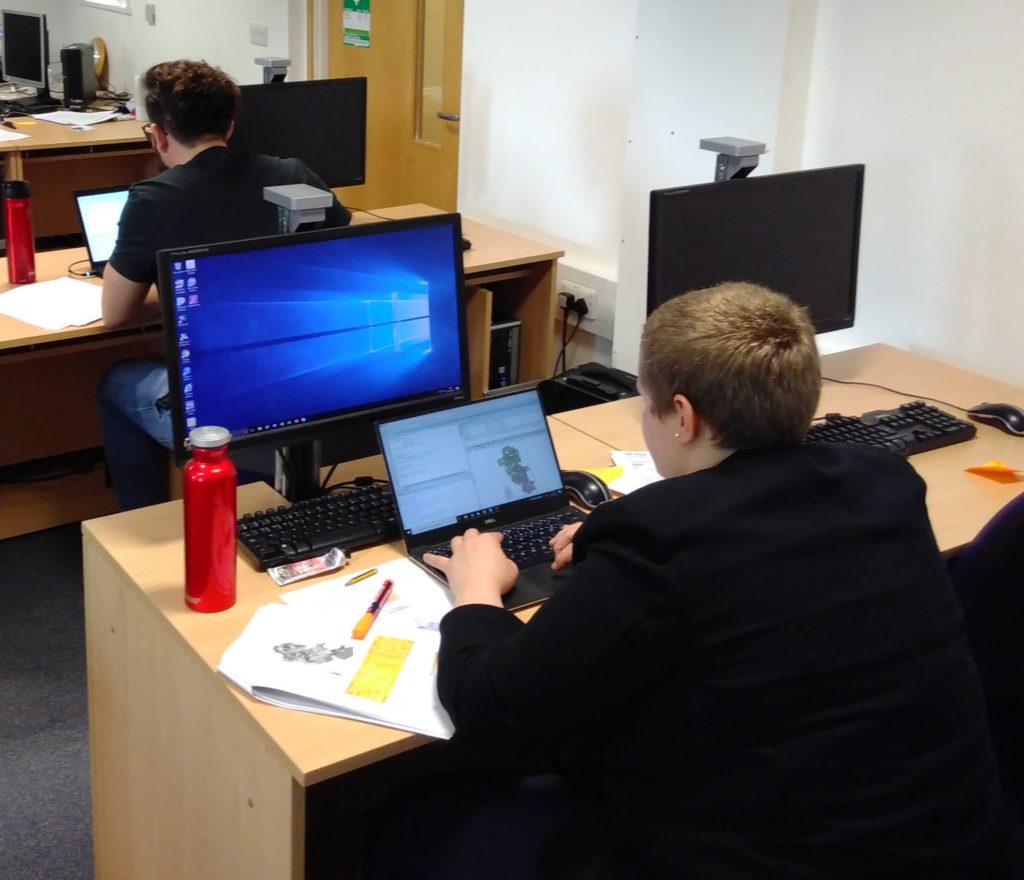
I recently ran my ‘Introduction to Spatial Data & Using R as a GIS’ course for the NCRM at the University of Southampton. This was the first time after I had updated the material from using the SP library to using the new SF library. The SF (or Simple Features) library is a big change in how R handles spatial data.

Back in the ‘old days’, we used a package called SP to manage spatial data in R. It was initially developed in 2005, and was a very well-developed package that supported practically all GIS analysis. If you have worked with spatial data in R and used the syntax variable@data to refer to the attribute table of the spatial data, then you have used the SP package. The SP package worked well, but wasn’t 100% compatible with the R data frame, so when joining data (using merge() or match()) you had to be quite careful, and we usually joined the table of data to the variable@data element. For those in the know, it used S4 data types (something I discovered when I generated lots of error messages whilst trying to do some analysis!)
The SF library is relatively new (released Oct 2016) and uses the OGC (Open Geospatial Consortium) defined standard of Simple Features (which is also an ISO standard). This is a standardised way of recording and structuring spatial data, used by nearly every piece of software that handles spatial data. Using SF also allows us to work with the tidyverse series of packages which have become very popular, driven by growth in data science. Previously, tidyverse expected spatial data to be a data frame, which the SP data formats were not, and often created some interesting error messages!
The Geospatial Training Solutions ‘Introduction to R’ course is very well established, and I have delivered it 14 times to 219 students! However, it was due for a bit of a re-write, so I took the opportunity of moving from SP to SF to do restructure some of the material. I also changed from using the base R plot commands to using the tmap library. As a result, it is now much easier to get a map from R. In fact, one of the participants from my recent NCRM course in Southampton said:
“It was so quick to create a map in R, I thought it would be harder.”
Participant on Introduction to Spatial Data & Using R as a GIS, 27th March 2019, University of Southampton
They were blown away by how easy it was to create a map in R. With SF and tmap, you can get a map out in 2 lines (anything staring with # is a comment):
LSOA <- st_read("england_lsoa_2011.shp")  #read the shapefile
qtm(LSOA) #plot the map
You can also get a nice looking finished map with customised colours and classification very easily:
tm_shape(LSOA) +
     tm_polygons("Age00to04", title = "Aged 0 to 4", palette = "Greens", style = "jenks")
 + tm_layout(legend.title.size = 0.8)

However, unfortunately not all spatial analysis is yet supported in SF. This will come with time, as the functions develop and more features are added. In the practical I get the participants to do some Point in Polygon analysis, where they overlay some crime points (from data.police.uk/data) with some LSOA boundaries. I couldn’t find out how to do a working point in polygon analysis* using this data and the SF library, so I kept my existing SP code to do this. This was also a useful pedagogical (teaching) opportunity to explain about SF and SP, as students are likely to come across both types of code!
*I know theoretically it should be possible to do a point-in-polygon with SF (there are many posts) but I failed to get my data to work with this. I need to have more of an experiment to see if I can get it working – if you would like to have a try with my data, please do!
The next course I am running is in Glasgow on 12th – 14th June where we will cover Introduction to Spatial Data & Using R as a GIS, alongside a range of other material over 3 days. Find out more info or sign up.
The material from this workshop is available under Creative Commons, and if you would like to come on a course, please sign up to the Geospatial Training Solutions mailing list.
Cross-posted from
http://www.geospatialtrainingsolutions.co.uk/spatial-r-moving-from-sp-to-sf.
Pingback: Spatial R - Moving from SP to SF - Geospatial Training Solutions
Pingback: 用R語言畫地圖 - 基礎篇 - 愛上R語言